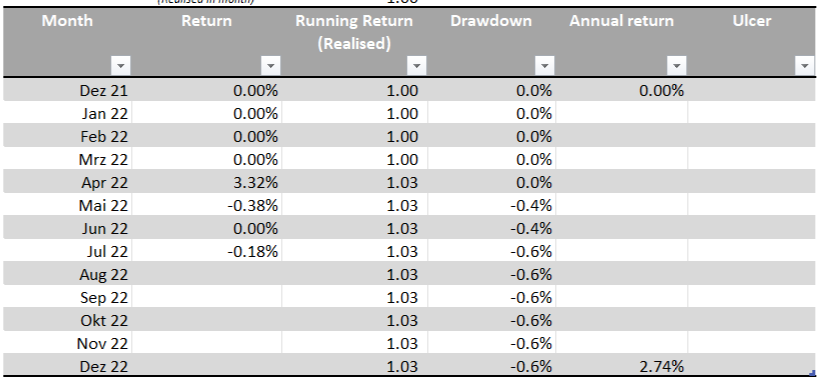
Since beginning of the year I improved the use of my spreadsheets for my trading quite a bit. I especially extended the tracking of the individual trades within the different strategies. This allows me to identify what works and what does not. And to improve the strategies over time. For each strategy, I now look at how the individual trades did, how the performance is month by month, and how the correlation between each strategy is. Based on that information, I can minimize redundancies and overall portfolio drawdowns. Not having had option strategies within my portfolio was one of the main reasons why I got hit so hard during the Q1/2022 crash. Besides the fact that the metrics did not work as normal during this exact market crash.
Therefore, I have composed two different trading approaches. Both complementing each other to a great portfolio.
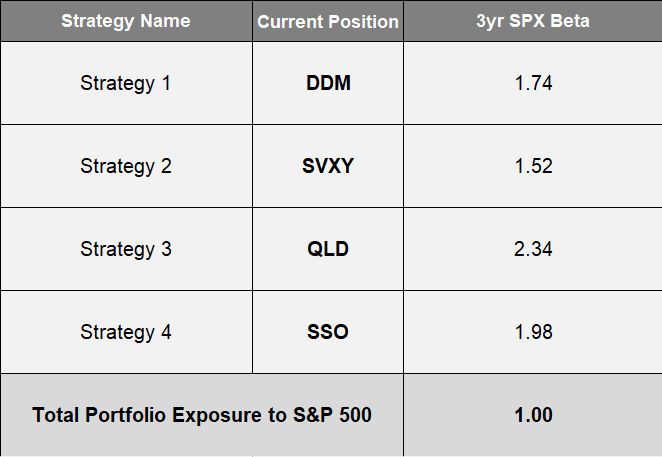
On the one hand, I use different ETFs where I am only invested in those having the highest probability of success based on current market metrics. The goal of this strategies is to keep the correlation to the broad stock market (S&P 500) as low as possible. Hence, beating the stock market in the long run by not being invested in risky ETFs in times of market fear.
To manage my daily trading routine, I already built spreadsheets for my ETF strategies a year ago. They allow me to input data daily and thus easily calculate the trades I must take during that day. This systematic approach allows me not to get influenced in my trading due to current events or such. I only need to input the current financial data and then execute the trades displayed at my dashboard. Changing the strategies is only done in periodic assessments, once or twice a year. In that process, I look at the trades I took and whether I am happy with the way the ETF allocations performed or not. And if necessary, make some adjustments. But as mentioned above, this sort of strategies can have its weak moments like beginning of 2022.
Consequently, on the other hand, I am ramping up different options strategies. As I am still in a steep learning curve using options, I am constantly improving these strategies. That is why I adapted the spreadsheet to closely follow the performances. The goal of the option strategies is to become completely independent of the stock market movements and be able to profit from any given market conditions. Be it bullish, flattish, or bearish – with options you can profit from all. But with options trading, you need to be as systematic as possible and always focus on the risk. To assure that, I worked a lot on the use of spreadsheets.
By consequently using spreadsheets, I am able increase my trading skills step by step. I will always be able to reconstruct the decisions I took when entering a trade. Whether it went well or not, I will understand why and what adjustments I must make going forward. Therefore, becoming a great trader in the long run.